
Manufacturer condition
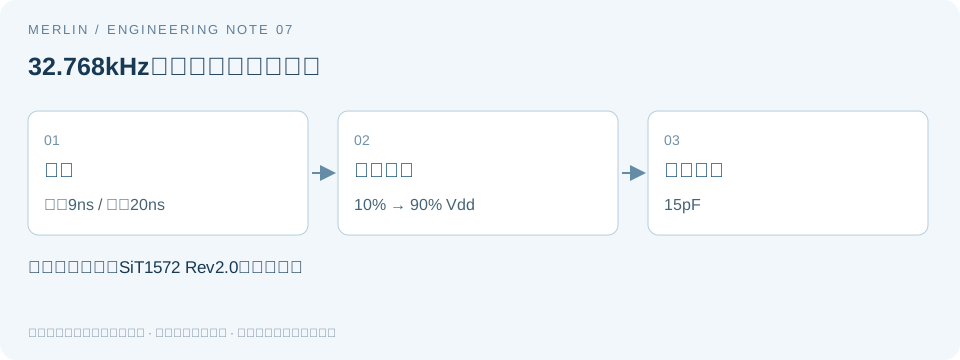
SiTime SiT1572 Rev 2.0 Table 1 lists rise and fall times of 9 ns typical and 20 ns maximum measured from 10% to 90% of VDD with a 15 pF load. Keep the value, thresholds and load together. A typical value does not establish the maximum, and other supply or load conditions require their own evidence.
Thresholds and loading
For an ideal single-pole rising edge, 10–90% takes approximately 2.197τ and 20–80% takes approximately 1.386τ, so the ratio is about 0.631. A smaller reading may simply reflect different thresholds. Real signals need not follow this model.
Receiver input, traces and probe capacitance all contribute to the load. The 32.768 kHz period is approximately 30.52 µs. Keep period, stability and edge time separate because receiver thresholds, sampling and noise can still make the transition significant.
| Condition | Record | Limit |
|---|---|---|
| Manufacturer test | 10–90% of VDD at 15 pF | Keep with the stated results |
| Manufacturer values | 9 ns typical, 20 ns maximum | Typical cannot be used as an acceptance limit |
| Single-pole example | 20–80% is about 0.631 of 10–90% | Model only |
| 32.768 kHz period | About 30.52 µs | Does not verify edge time |
Measure under project conditions
Record the ordering option, supply, temperature, load and thresholds. Measure both rise and fall times. If test conditions depart from the datasheet, document the differences and seek a supplemental specification or validate to the project requirements. One waveform does not establish performance over every supply, temperature or load.
References and scope
MERLIN used AI assistance to compile this technical guide. Numerical examples are hypothetical unless identified as manufacturer specifications. They are not sample measurements, compatibility guarantees, or statements of availability.