
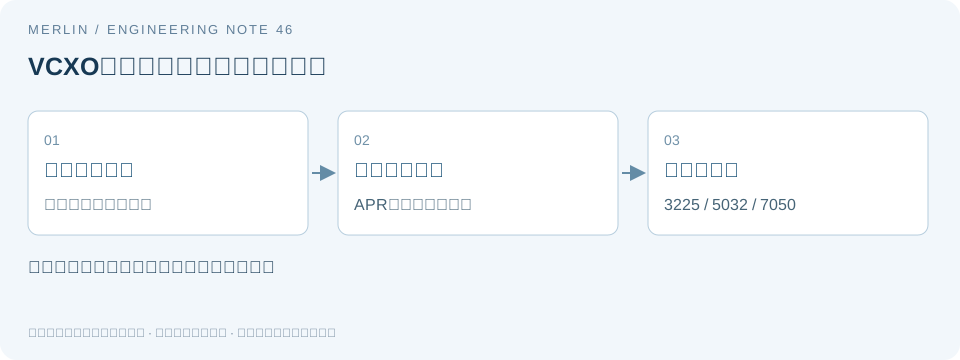
Calculating 50 MHz VCXO Pull Margin with APR, Control Voltage, and Loop Gain
In a PLL, a nominal VCXO pull range of ±100 ppm does not guarantee tracking of ±100 ppm across all temperature and lifetime conditions. This case starts with a hypothetical 50 MHz device and a ±3 kHz tracking requirement, calculates the APR limits, and checks the range covered by the available control voltage.
1. Convert hertz and ppm to the same units
Frequency offset in ppm = Δf/f₀ × 10⁶. At 50 MHz, 1 ppm = 50 Hz, so ±3 kHz corresponds to ±60 ppm, and a nominal ±100 ppm corresponds to ±5 kHz. This conversion leaves the center-frequency error and actually reachable control-voltage endpoints to be evaluated separately.
Absolute pull range (APR) typically expresses the pull range guaranteed after accounting for specified frequency errors. The datasheet defines which effects are included. Count any temperature, supply, or aging effects included in the guaranteed APR only once.
2. Compare guaranteed limits
Suppose candidate A guarantees ±55 ppm APR, equivalent to ±2750 Hz, which falls short by 250 Hz. Candidate B guarantees ±70 ppm APR, equivalent to ±3500 Hz, leaving a preliminary static margin of 500 Hz. Compare both candidates under the same environmental, lifetime, and control-voltage conditions.
A typical tuning curve can show direction and linearity. Use guaranteed minimum values for acceptance. If the guarantee is missing over part of the tuning range, record the gap in the design review.
3. Check the range available at the actual control voltage
Suppose a VCXO requires 0.3–3.0 V on the control pin to achieve the specified pull range, but the control source can only supply 0.5–2.8 V. Each endpoint falls short by 0.2 V, which may reduce the usable range. Evaluate it against the tuning curve and guarantee conditions for the actual voltage range.
For a local linear estimate, assume a tuning slope of 40 ppm/V. A 10 mV control-voltage error then causes about 0.4 ppm, or about 20 Hz at 50 MHz. This is a sensitivity estimate. The actual slope depends on part, temperature, and operating point. Verify the guaranteed behavior over the full range separately.
4. Verify static range and closed-loop dynamics separately
Tuning slope and polarity affect PLL loop gain. Even if a replacement VCXO covers the required range, lock time, damping, and noise transfer may change. Verify closed-loop performance directly.
On a prototype, sweep the control voltage and record the frequency response. Then check lock behavior, recovery from disturbances, and noise under system conditions. Record the actual control swing, reference frequency offset, temperature, supply, and loop configuration. Before measurements are available, report the budget and checks still pending qualification.
Calculation and record table
| Hypothetical condition | ppm | Equivalent at 50 MHz |
|---|---|---|
| Tracking requirement | ±60 | ±3000Hz |
| Candidate A guaranteed APR | ±55 | ±2750 Hz, short by 250 Hz |
| Candidate B guaranteed APR | ±70 | ±3500 Hz, 500 Hz margin |
| 10 mV control error at a slope of 40 ppm/V | 0.4 | Local estimate of about 20 Hz |
References and applicability
This technical analysis uses public documentation and was prepared with AI assistance. All worked examples are hypothetical. They do not establish product specifications, measured results, or compatibility. For a specific device, use the exact ordering configuration, the latest manufacturer datasheet, and board-level validation.
See the manufacturer reference Epson Crystal Device technical terms and applicable conditions.
Related selection guides
For help documenting these parameters in a BOM or RFQ, see MERLIN’s VCXO control-voltage and pull-range selection documentation. Confirm specific part parameters against the applicable manufacturer datasheet and project validation.
Why positive and negative pull limits matter even when the total range is sufficient
Question and manufacturer guidance
When replacing a voltage-controlled part, the total tuning span in ppm can hide where the center falls. Two parts may have the same span while one falls short of the required calibration margin on one side. Record both limits on the RFQ and acceptance checklist.
TXC’s official FAQ item 11 discusses insufficient and asymmetric pulling. The FAQ treats pull magnitude and distribution on each side as separate checks. Part-specific guarantees come from the relevant crystal or VCXO specifications.
Engineering analysis and limits
Compare the center frequency, low endpoint, and high endpoint using the same reference. For a fixed target f₀, calculate each signed endpoint offset as (fendpoint − f₀)/f₀. Re-centering around the average of asymmetric endpoints would hide their offset from the actual target.
For a hypothetical 10 MHz example, endpoints of 9,999,900 Hz and 10,000,700 Hz correspond to −10 ppm and +70 ppm, for a total span of 80 ppm. If the project requires −40 ppm to +40 ppm, the low side is short by 30 ppm, or 300 Hz, even though the total span matches.
Record the center point as well. If the frequency at the midpoint of the control-voltage range is already offset from the target, more tuning margin may be available on one side. The center and endpoints can reveal asymmetry. Identifying whether the cause lies in the crystal, control source, or circuit topology requires further checks.
Verification steps
Check the manufacturer’s allowable control-voltage range first, then choose test points and measure voltage and frequency at each point. Cover the temperature, supply, and configuration changes required by the project and retain more than two room-temperature endpoints. Keep every test point within the device ratings.
Distinguish a passive crystal with an external pulling network from an integrated VCXO. The load and active circuitry affect the former. For the latter, verify the exact ordering configuration, control function, and guaranteed range. These examples show how to record and interpret the data. Circuit tuning and control-voltage limits depend on the specific part.
Check and record table
| Item or condition | Check or calculation | Interpretation and limits |
|---|---|---|
| Low endpoint 9,999,900 Hz | −10 ppm relative to 10 MHz | Hypothetical measurement |
| High endpoint 10,000,700 Hz | +70 ppm relative to 10 MHz | Hypothetical measurement |
| Target low limit −40 ppm | Low side short by 30 ppm = 300 Hz | The total span does not fill the low-side shortfall. |
| Values to retain | Reference, center point, and voltage and frequency at both endpoints | Retain the original reference so the offset stays visible. |
Manufacturer documentation and applicability
https://www.txccorp.com/en/faq/
AI assisted in preparing this article. The manufacturer requirements and the engineering analysis are presented separately. Unless explicitly identified as manufacturer specifications, all worked examples are hypothetical and were not verified on samples. Use the specific datasheet and project validation to determine specifications and compatibility for a candidate part.
Related selection guides
For help documenting these parameters in a BOM or RFQ, see MERLIN’s VCXO pull-range and control-parameter checks. Confirm specific part parameters against the applicable manufacturer datasheet and project validation.